Affiliate Asset Solutions

Revenue Cycle Management for Healthcare Providers
Affiliate Asset Solutions is a revenue cycle management company serving healthcare clients across the U.S. Founded in 2015 by industry veterans, the firm provides full-cycle billing, collections, and patient support. Our commitment is to deliver ethical, compliant service with respect and transparency — both to our clients and their patients.
From IT Leadership to Strategic Reporting

Phase 1: IT Infrastructure and Onsite Systems Support (2015–2016)
As the first employee at Affiliate Asset Solutions, I helped build the entire infrastructure from the ground up — from workstation setup and network reliability to daily systems support.
This included:
- Sourcing, configuring, and deploying dozens of agent workstations
- Managing network reliability and patch bay organization
- Securing software installs and system lockdown per executive policy
- Rewiring and restoring cubicle power using sourced industrial parts
- Setting up training room computers for new hire orientation
Phase 2: Performance Data Reporting (2016–2019)

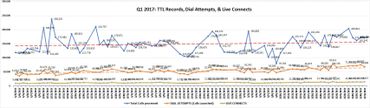
As the company grew, I transitioned from systems support into performance reporting and strategic analytics. I began by exporting data from our CRM system (BFrame) and dialer platform (LiveVox), each of which had different formats and schema structures.

To transform this raw data into actionable reports:
- I built Excel workbooks with custom formulas and VBA macros to normalize and analyze metrics like call volume, agent performance, and financial outcomes.

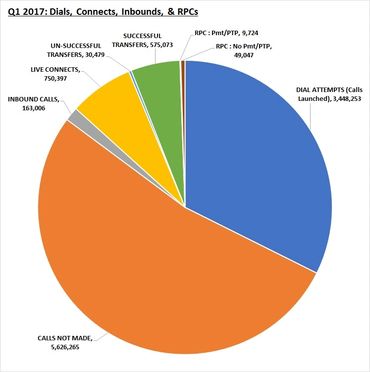
As the company scaled, I shifted from IT support to data analytics. This report was part of my effort to turn complex CRM and dialer data into actionable dashboards and performance insights.
Graphs, Trendlines, and Data Visualizations
Enter Big Data Work
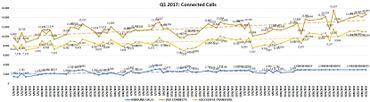
As the company grew, I transitioned from systems support into performance analytics. I began exporting data from our CRM and dialer platforms—each with different schema structures—and built custom tools to normalize, analyze, and present the results clearly.
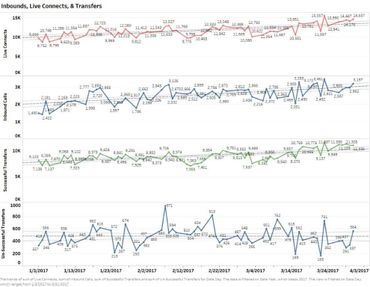
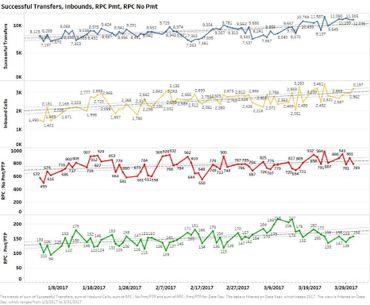
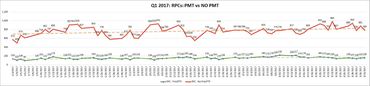
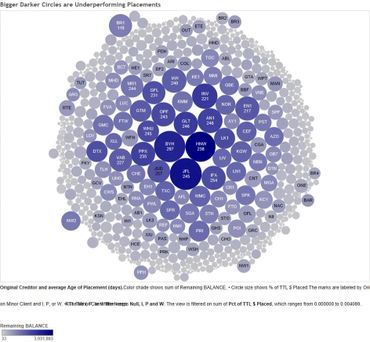
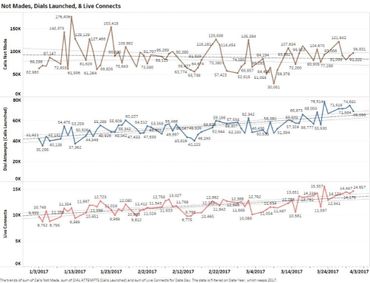
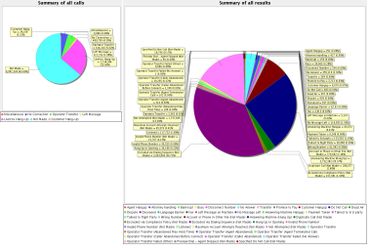
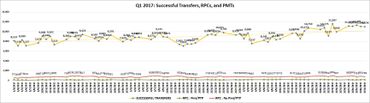
I created Excel workbooks with advanced formulas and VBA automation, developed Access databases to generate standardized reporting, and used Tableau to build interactive charts and trend displays that highlighted key business patterns. The samples below reflect the evolution of these efforts.
As our datasets expanded, we reached the capacity limits of Microsoft Access. We migrated to an off-site SQL Server, and I used Access’s built-in tools to generate SQL queries and manage connections to the server—allowing me to continue building reports while tapping into larger data sources. I also broadened our use of Tableau to support more complex data models and deliver clear, scalable insights.

From Excel, to Access, to Tableau